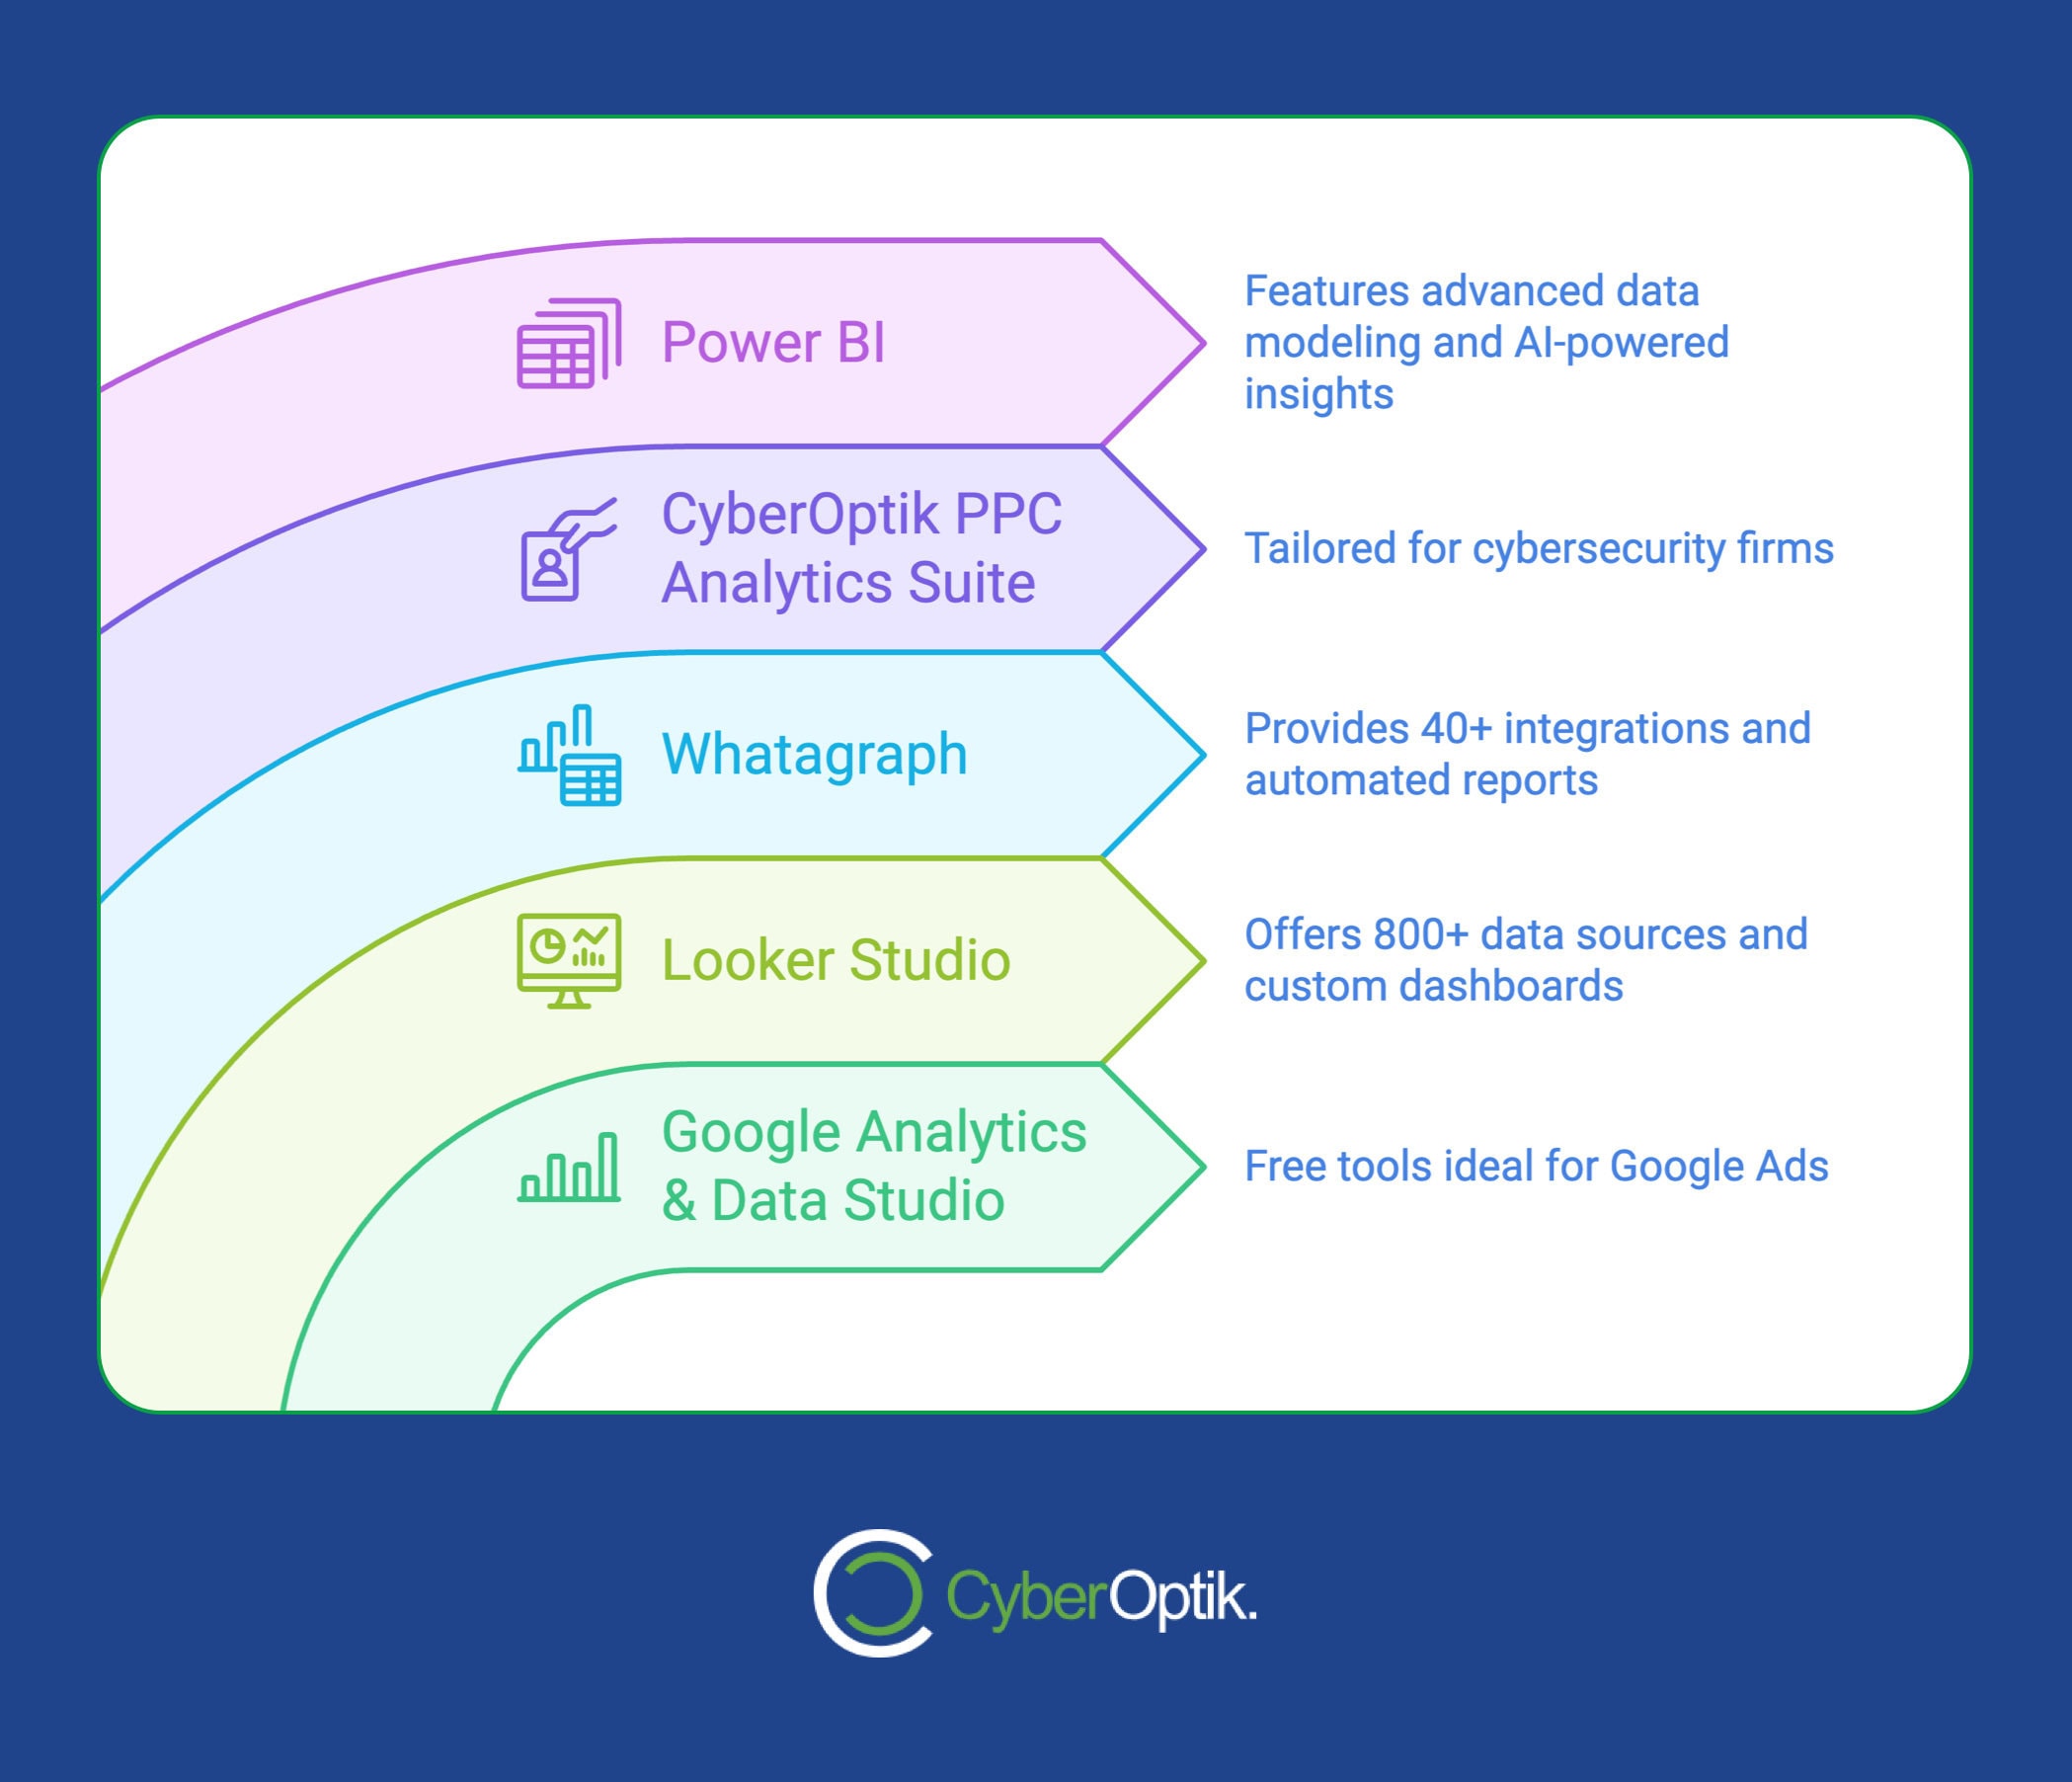
Looking for the best PPC reporting tools? Here’s a quick rundown of the top options:
- Google Analytics & Data Studio: Free, great for Google Ads
- Looker Studio: 800+ data sources, custom dashboards
- Whatagraph: 40+ integrations, automated reports
- CyberOptik PPC Analytics Suite: Specialized for cybersecurity firms
- Power BI: Advanced data modeling, AI-powered insights
Quick Comparison:
| Tool | Price | Best For | Standout Feature |
|---|---|---|---|
| Google Analytics & Data Studio | Free | Google Ads users | Real-time stats |
| Looker Studio | Free (Pro available) | Multi-platform reporting | 800+ data sources |
| Whatagraph | $199/month | Agencies | Automated client reports |
| CyberOptik Suite | Custom | Cybersecurity firms | Niche-specific features |
| Power BI | $9.99/user/month | Data analysis | AI-powered insights |
Choose based on your budget, data sources, and reporting needs. Most offer free trials, so test before committing.
Google Analytics & Data Studio
Google Analytics and Data Studio are key players in PPC reporting. They’re different tools, but they work great together.
Google Analytics is your data collector. It tracks how people use your website, including those who click on your PPC ads. With Google Analytics, you can:
- See important PPC numbers like clicks and conversions
- Set up goals to track specific actions
- Understand how people behave on your site
- Break down your audience into groups
Data Studio is where you turn that data into eye-catching reports. It lets you:
- Make custom dashboards that mix data from different places
- Show PPC results alongside other marketing data
- Share reports that people can interact with
The real power comes from using both tools together. Let’s say you’re running Google Shopping campaigns for an online store. You can use the “Ecommerce PPC” template in Data Studio. This template pulls in data from both Google Analytics and Google Ads, giving you a full picture of how your campaigns are affecting sales.
One big plus of using Google’s tools for PPC reporting is how well they work together. Data from Google Ads flows right into Analytics and Data Studio. No need to enter data by hand or set up complicated connections.
But what about data from other ad platforms? That’s where third-party connectors come in. Since March 2018, Data Studio can connect to over 30 ad platforms. For example, Supermetrics lets you automatically pull in data from Facebook Ads and Bing Ads. This way, you can see all your PPC data in one spot.
When you’re making PPC reports in Data Studio, try these tips:
- Start with a sketch. Draw out what metrics you want and how you want your report to look before you start building. It can save you a lot of time.
- Use templates. Data Studio has over 50 ready-made templates, including many for PPC reporting. They’re a great starting point.
- Make sure you have admin access. You’ll need it to connect your accounts to Data Studio.
- Watch out for different names. Different platforms might call the same thing by different names. Make sure you’re consistent in your reports.
- Use real-time updates. Data Studio reports update automatically, so you can make quick decisions based on the latest info.
2. Looker Studio
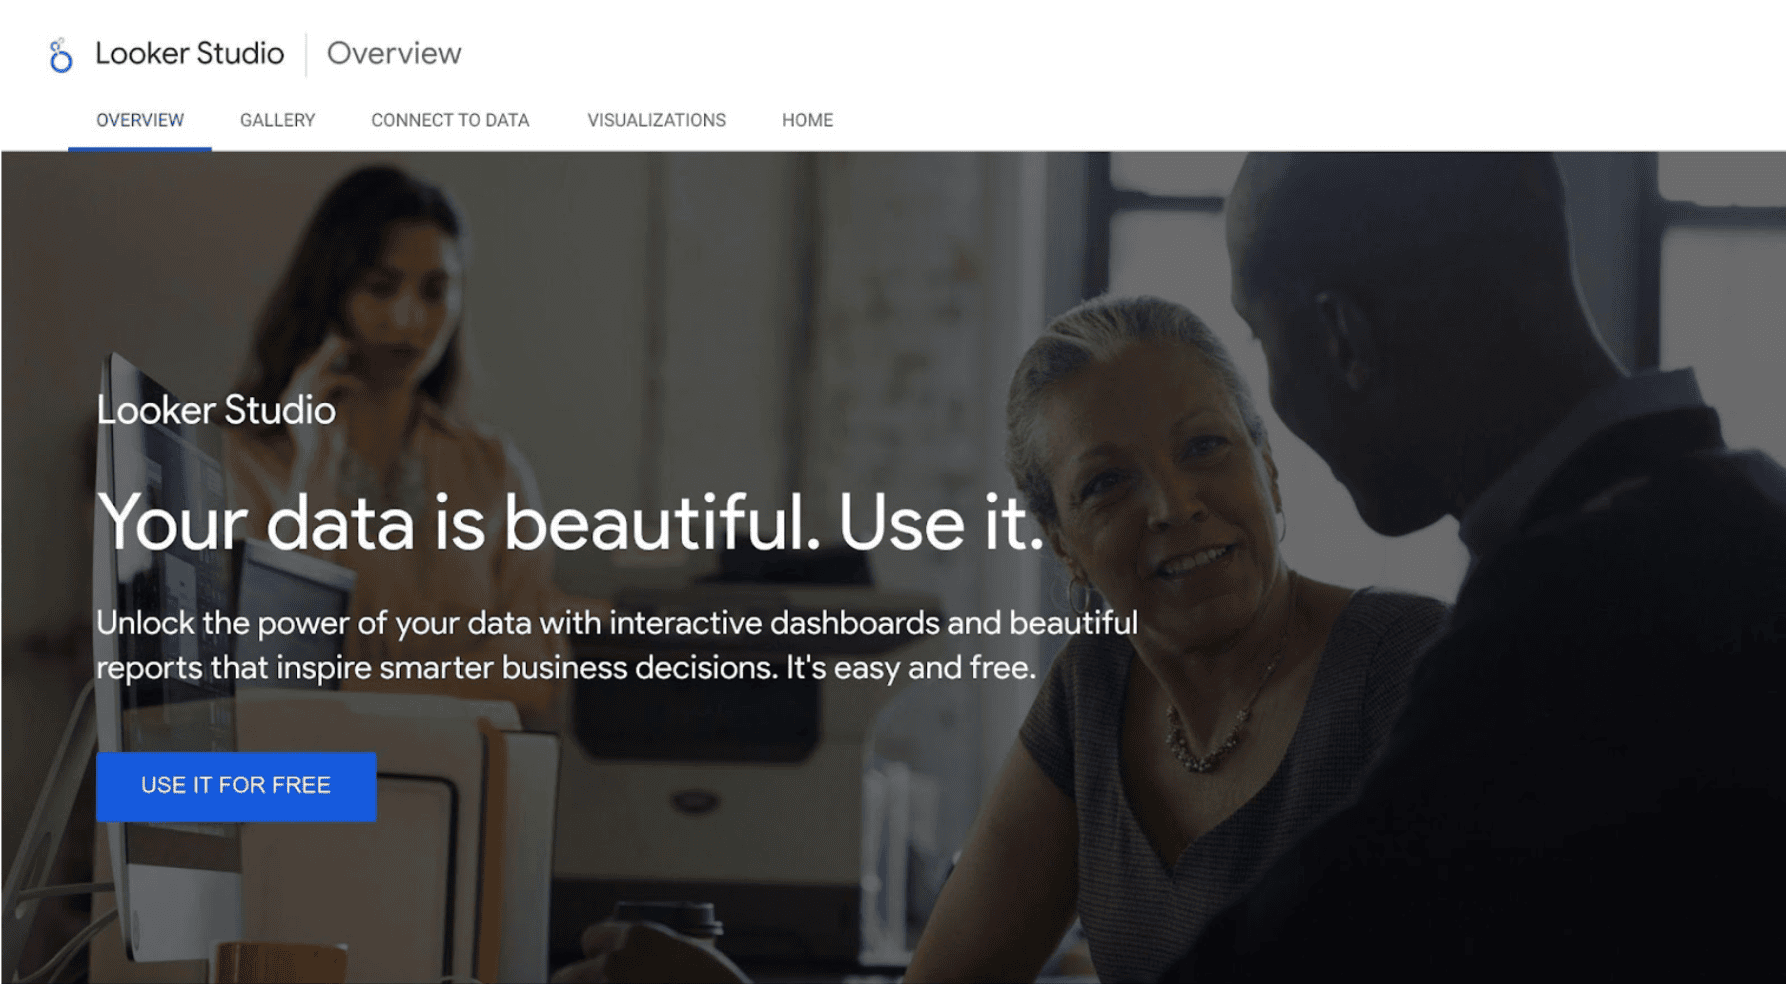
Looker Studio (previously Google Data Studio) is a game-changer for PPC reporting and data visualization. It’s like a Swiss Army knife for marketers who want to track, analyze, and showcase their campaign results in a way that’s both visually appealing and easy to grasp.
Here’s what makes Looker Studio stand out:
- It connects to over 800 data sources, from Google Analytics to Facebook Ads
- You can create custom PPC dashboards that fit your exact needs
- Real-time collaboration lets your team work together seamlessly
- White labeling options let agencies add their own branding
But here’s the real kicker: Looker Studio lets you build multi-channel PPC dashboards. Imagine seeing your Google Ads, Facebook Ads, and LinkedIn Ads performance all in one place. It’s like having a bird’s-eye view of your entire PPC landscape.
“If you’ve been struggling with your reporting and you didn’t know how to consolidate your stats without a dedicated workforce of data scientists, then sorry, you’re out of excuses now.” – Brafton Author
This quote nails it. Looker Studio makes advanced PPC reporting accessible to everyone, not just data wizards.
Let’s say you’re running PPC campaigns for an online store. Here’s how you might use Looker Studio:
- Connect your data sources (Google Ads, Facebook Ads, Google Analytics)
- Build a dashboard that shows key metrics like ROAS, CPC, and conversion rates
- Add custom charts to compare performance across platforms
- Set up hourly data refreshes
- Share the live dashboard with your client or schedule regular PDF reports
Now, Looker Studio isn’t perfect. Some users complain about slow refresh rates on complex dashboards, and you’re limited to 50 components per page. Plus, there’s no direct customer support, which can be a pain if you run into issues.
But despite these hiccups, Looker Studio is still a powerhouse for PPC pros. Its tight integration with Google’s ecosystem and flexible visualization options make it a top contender in the PPC reporting tools arena.
Kate Wright, Senior Director for BI Product Management at Google, puts it this way:
“With the changes, users can gain modern solutions to help them access and collect in-depth, consistent data with real-time dashboards.”
In other words, Looker Studio is giving marketers the tools they need to make smart, data-driven decisions in their PPC campaigns. And in today’s fast-paced digital marketing world, that’s worth its weight in gold.
3. Whatagraph
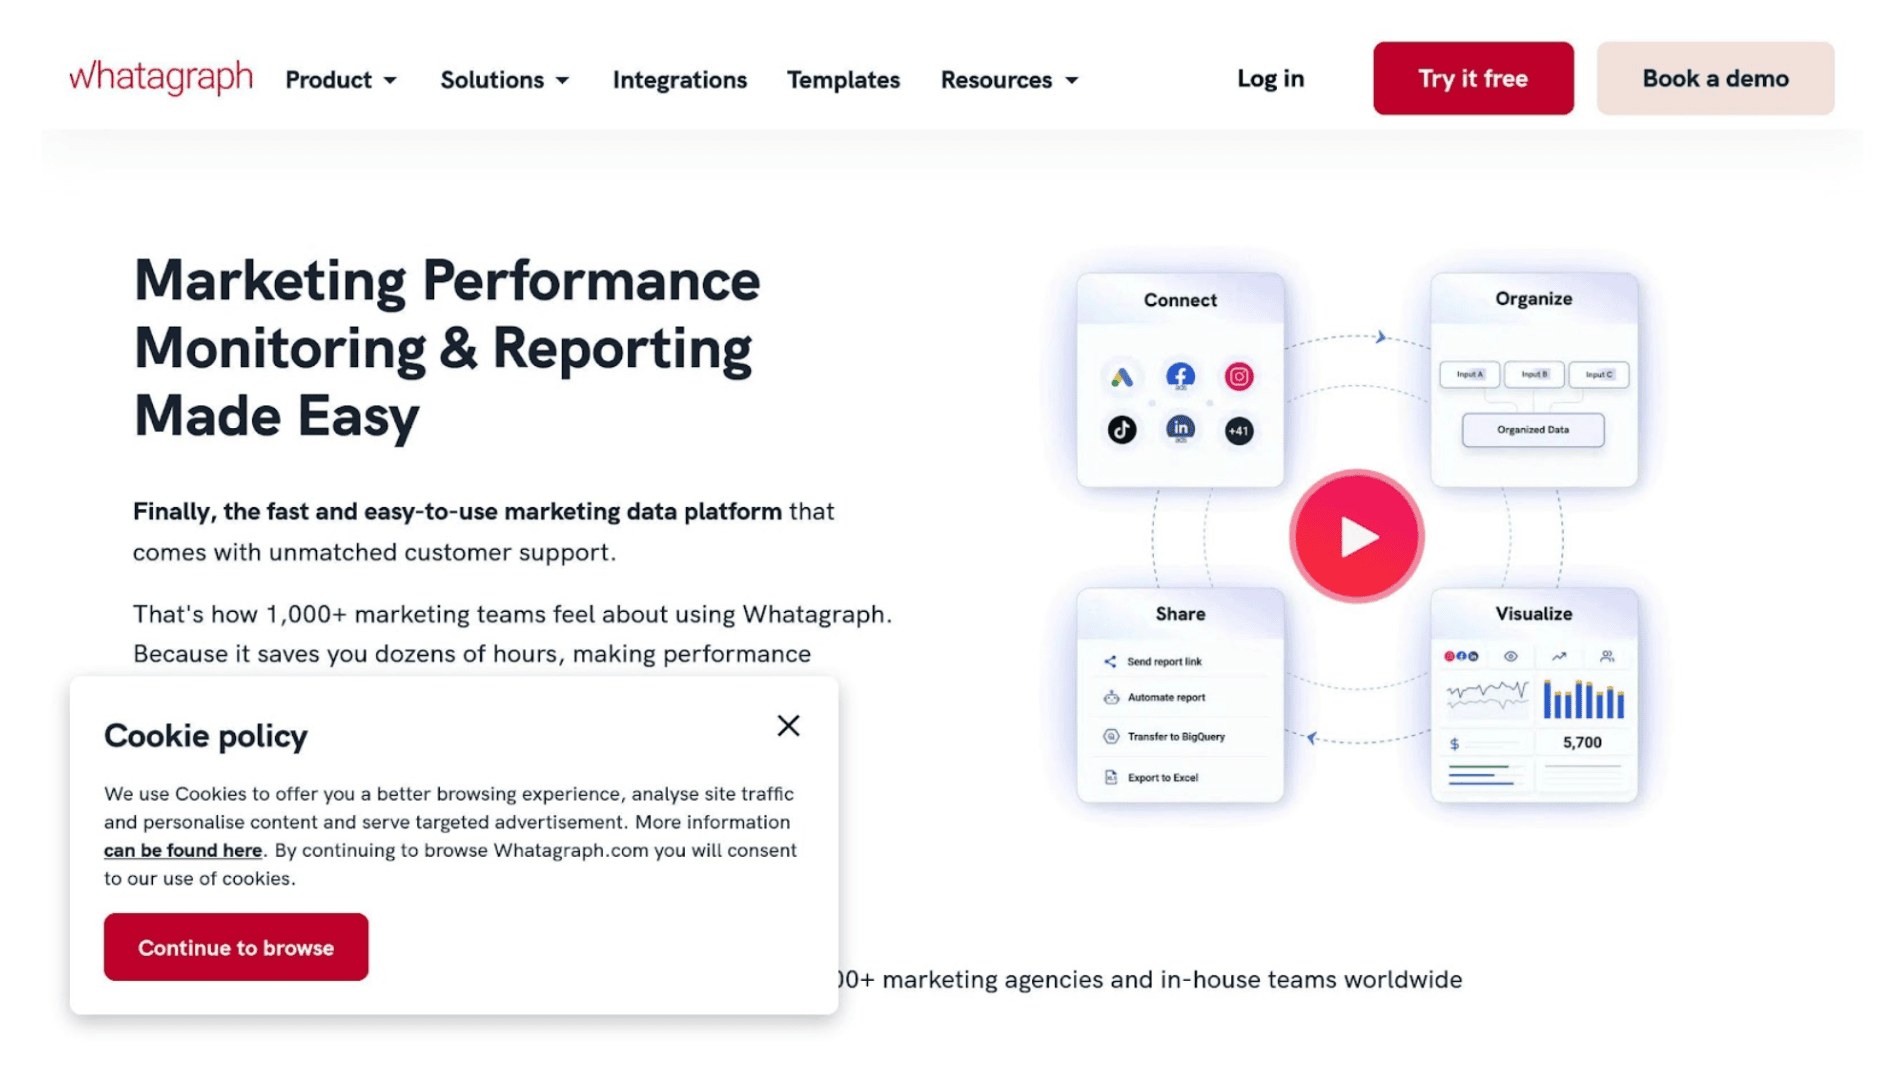
Whatagraph is a PPC reporting tool that cuts through the noise of marketing analytics. It’s a cloud-based platform that’s all about making life easier for agencies and in-house marketers.
Here’s the deal: Whatagraph connects with over 40 data sources. We’re talking Google Ads, Facebook Ads, LinkedIn Ads – the whole shebang. This means you can create reports that show the big picture of your PPC efforts across different channels.
Let’s say you’re a digital marketing agency juggling multiple client accounts. With Whatagraph, you can:
- Pull data from various ad platforms into one dashboard
- Create custom reports that focus on each client’s specific KPIs
- Set up automatic report delivery (daily, weekly, or monthly)
This automation is a real time-saver. As Wendy Gooseberry, a content creator, puts it:
“Whatagraph allows you to create and automate visual marketing reports within minutes.”
But it’s not just about saving time. Whatagraph is user-friendly too. You’ve got over 100 pre-built report templates to choose from, or you can make your own using a drag-and-drop editor. This makes it easy to present data in a way that’s visually appealing and easy to understand – crucial when you’re trying to explain campaign performance to clients or bosses.
Whatagraph has some cool features that make it stand out:
- Multisource insights: You can combine data from different sources in the same widgets. It’s like having a Swiss Army knife for your data.
- Custom data import: Got data from a source that’s not supported? No problem. You can import it from Google Sheets or connect your own data sources.
- White labeling: Agencies can create fully branded reports. You can remove Whatagraph’s branding and make it look like your own.
Now, let’s talk money. The Professional Plan starts at $199 per month (billed annually). This gets you up to 15 connected data sources, 20 reports, and five users. Need more? The Premium Plan at $299 per month bumps that up to 30 data sources, 50 reports, and 15 users.
One downside: There’s no free trial or freemium version. This might be a bummer for smaller businesses or freelancers who want to test the waters first.
But for many users, the value is in the time saved and improved client communication. As Virtual Valley says: “Whatagraph saves time, simplifies the reporting process, and helps businesses make informed decisions based on accurate and up-to-date data.”
For PPC pros, Whatagraph’s real-time data updates and automated report scheduling can be game-changers. You can set up daily or weekly reports to keep a close eye on campaign performance, making it easier to tweak your ad spend and boost ROI.
Bottom line: If you’re looking to streamline your PPC reporting and deliver eye-catching, data-rich reports, Whatagraph is worth checking out. Its mix of integrations, customizable templates, and automation features make it a solid choice in the world of PPC reporting tools..
4. CyberOptik PPC Analytics Suite
CyberOptik, we are a Chicago-based digital marketing agency, who have cooked up something special for cybersecurity firms: a PPC Analytics Suite that’s all about boosting those pay-per-click campaigns.
What makes it tick? It plugs right into Google Ads and Microsoft Ads, giving you real-time data across your PPC channels. But here’s where it gets interesting:
- Keyword research on steroids: By teaming up with Semrush, we dig up those juicy long-tail keywords that cybersecurity pros are actually searching for.
- Retargeting that’s scarily good: It lets you slice and dice your audience based on how they’ve interacted with your site before. The result? Ads that feel like they’re reading minds.
- A/B testing made easy: Want to know if your ad headline is a hit or a miss? Our tool’s got you covered.
- Reports that speak your language: Forget generic metrics. You can whip up reports that show exactly what your cybersecurity clients care about.
Now, CyberOptik isn’t as big as some PPC tool giants out there. But that might mean you get more personal attention from us.
The bottom line? If you’re in cybersecurity and your PPC campaigns need a shot in the arm, CyberOptik’s suite might be worth a look. Just remember, it’s from a smaller shop – which could mean more personal service, but maybe fewer bells and whistles than the big guys offer.
5. Power BI
Microsoft Power BI is a data analysis powerhouse for PPC reporting. It’s like a Swiss Army knife for your ad data – versatile and surprisingly easy to use.
Here’s the scoop:
Power BI connects to tons of data sources. It doesn’t link directly to Google Ads, but there’s a workaround. Coupler.io, a third-party tool, bridges this gap.
Borys Vasylchuk, a Performance Marketing Expert at Coupler.io, explains:
“With Coupler.io, Google Ads is connected to Power BI, where you can visualize data, create actionable reports, and use dashboards for analysis and business intelligence.”
This means you can pull in Google Ads data, mix it with other sources, and create eye-catching visuals easily.
But Power BI isn’t just about pretty charts. It’s got some serious muscle:
- Advanced Data Modeling: Link different data sets. Connect PPC data with CRM data, website analytics, and more for a full view of your marketing efforts.
- AI-Powered Insights: Automatically spot trends and anomalies in your data. Catch issues like sudden drops in click-through rates early.
- Natural Language Queries: Ask questions about your data in plain English. Type “What was our best performing ad group last month?” and get instant answers.
The PPC Multi-Channel Dashboard in Power BI is a game-changer. It pulls data from Google Ads, LinkedIn Ads, Facebook Ads, and Bing Ads into one view. Track key metrics like CPC, CTR, and CPM across all channels to see which platforms perform best.
The best part? You don’t need to be a data scientist to use Power BI. Its drag-and-drop interface lets PPC managers without coding skills create pro-looking dashboards.
Power BI offers different pricing options:
- Desktop version: Free
- Power BI Pro: $9.99 per user per month
- Power BI Premium: $4,995 per month (for larger organizations)
Is it worth it? If you’re managing multiple ad platforms and need deep insights, Power BI could be your go-to tool. It handles large datasets, creates complex visuals, and integrates well with other Microsoft products.
But it’s not all smooth sailing. The learning curve can be steeper than other tools, especially if you’re not an Excel whiz. And while it’s great for various data sources, it can struggle with some cloud-based data outside the Microsoft world.
Tool Comparison
Let’s break down the top PPC reporting tools and see how they stack up:
Google Analytics & Data Studio vs. Looker Studio
Google Analytics and Data Studio make a solid free duo for PPC reporting. They work great with Google Ads and show you real-time stats. But Looker Studio (the new name for Data Studio) kicks it up a notch:
- It connects to over 800 data sources, not just Google stuff
- You can make custom PPC dashboards exactly how you want
- Teams can work together on reports in real-time
Kate Wright from Google says:
“With the changes, users can gain modern solutions to help them access and collect in-depth, consistent data with real-time dashboards.”
Whatagraph vs. Power BI
Both are great for multi-platform PPC reporting, but they’re different beasts:
- Whatagraph is easier to use, with tons of ready-made report templates
- Power BI digs deeper into data and has some cool AI features
- Whatagraph costs more, starting at $199/month, while Power BI Pro is just $9.99/user/month
Power BI has this neat trick where you can type questions like “What was our best performing ad group last month?” and get instant answers. Pretty handy for quick PPC insights.
CyberOptik PPC Analytics Suite
This one’s a bit of a dark horse, but it’s got some tricks up its sleeve for cybersecurity firms:
- It teams up with Semrush for deep keyword research
- You can target audiences based on how they’ve interacted with your site before
- It’s built specifically for cybersecurity clients
Feature Comparison Table
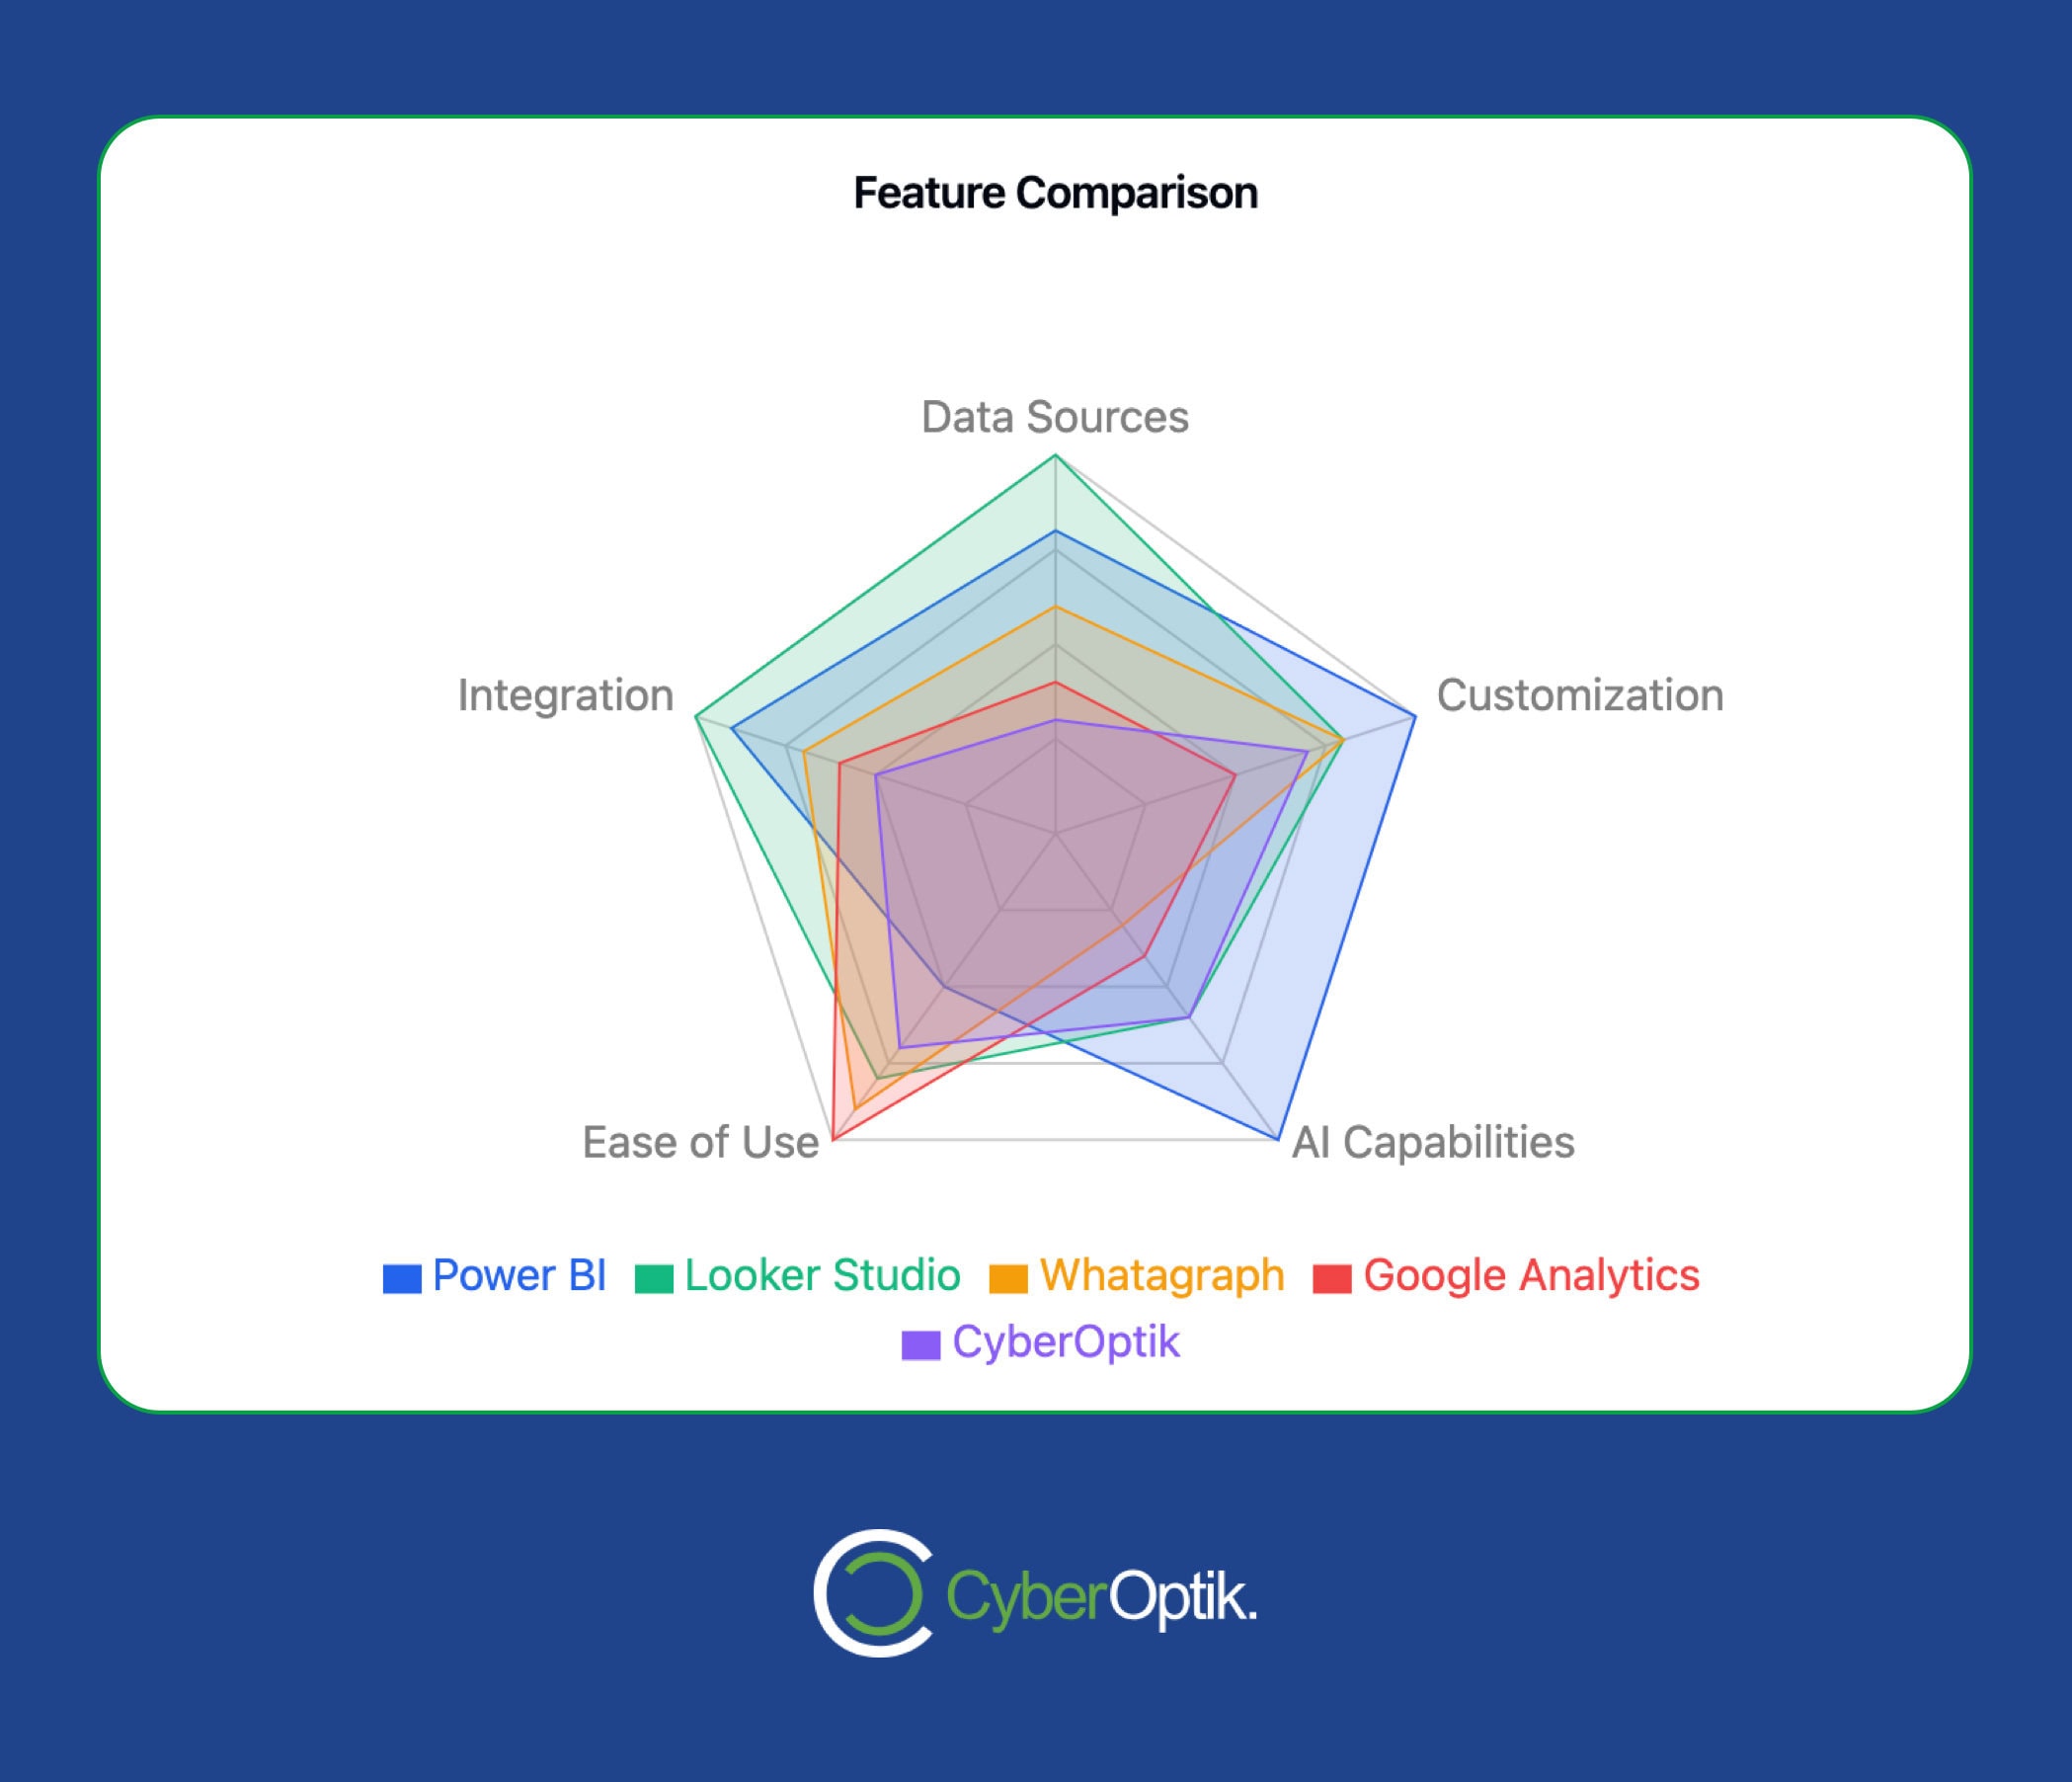
| Feature | Google Analytics & Data Studio | Looker Studio | Whatagraph | Power BI | CyberOptik PPC Suite |
|---|---|---|---|---|---|
| Price | Free | Free (Pro version available) | Starts at $199/month | $9.99/user/month (Pro) | Custom pricing |
| Data Sources | Mostly Google | 800+ | 40+ | 100+ | Focuses on Google Ads and Microsoft Ads |
| Customization | So-so | High | High | Super high | High (for cybersecurity) |
| AI Smarts | Basic | Okay | Not much | Advanced | Okay |
| Specialty | General stats | Making data look pretty | Agency reporting | Deep data diving | Cybersecurity PPC |
Picking the right PPC reporting tool depends on what you need:
- Tight budget?
Start with Google Analytics and Data Studio. They’re free and pack a punch for most small to medium businesses.
- Dealing with tons of data?
Power BI is your go-to. It can handle massive datasets, perfect for big PPC campaigns.
- Running an agency?
Whatagraph is a time-saver. It makes client reports look slick and sends them out automatically.
- In the cybersecurity game?
Check out CyberOptik’s suite. It’s built just for you.
- All about integrations?
If you’re deep in the Google world, Looker Studio fits like a glove. For Microsoft fans, Power BI is the natural choice.
Which Tool Should You Choose?
Picking the right PPC reporting tool can make a huge difference in your campaign management. Here’s a breakdown based on what you might need:
Google-centric campaigns? Go for Looker Studio (previously Google Data Studio). It’s free and works like a charm with Google Ads and Analytics.
“With the changes, users can gain modern solutions to help them access and collect in-depth, consistent data with real-time dashboards.” – Kate Wright, Google
Microsoft fan? Power BI is your go-to. At $9.99 per user monthly, it’s budget-friendly and plays nice with Excel and Azure. It’s a powerhouse for big datasets and fancy visuals.
Juggling multiple clients? Whatagraph might be your best bet. It’s pricier (starts at $199/month) but offers:
- Connections to 40+ data sources
- Automatic report scheduling
- White-labeling options
Running a cybersecurity firm? Check out the CyberOptik PPC Analytics Suite. It’s built for your niche, we work with Semrush for keyword research, and have special retargeting features.
On a tight budget? Start with Google Analytics and Data Studio. They’re free and pack enough punch for most small to medium businesses.
Love diving into data? Power BI is your playground. It has AI-powered insights and lets you ask questions in plain English (like “What was our best performing ad group last month?”).
The right tool depends on what you need. Think about:
- How it fits with your current platforms 2. If it can grow with your campaigns 3. How much you can customize reports 4. If your team can use it easily 5. What kind of support you can get
Don’t just take our word for it, get a proposal today from our team!


